Report · AI in IT operations
More code, less confidence
Where quality breaks in agile teams — what DORA 2025, GitClear, LinearB and Stack Overflow data say about why scrum teams ship worse code, and the habits of the teams that don't.
Agile teams merge more code than ever. They trust it less than ever.
Three numbers frame the problem.
63%
of organizations struggle to deliver reliable, high-quality software — 12 points worse than a year earlier
18th State of Agile Report
95%
of developers now use AI tools at work
DORA 2025
33%
trust the accuracy of what those tools produce — down from 43% in 2024
Stack Overflow Developer Survey 2025
Sources for those figures, in order: the 18th State of Agile, DORA 2025 and Stack Overflow 2025.
The sprint ceremonies didn’t change. The economics of code did. This is what the recent data says about where quality breaks in scrum teams, and what the teams that escape it do differently.
The bottleneck moved from writing to reviewing
For twenty years the constraint was writing code. That constraint is gone, and the queue moved downstream.
LinearB analyzed 8 million pull requests. AI-assisted PRs are 2.5x larger than human-authored ones: 400 changed lines against 157 at the 75th percentile. They wait 5x longer for a first review — 16+ hours against roughly 3.3. And they merge at 32.7%, less than half the 84.5% rate of human-authored work.
There is a darker detail in the same dataset. Once review finally starts, AI-heavy PRs get approved faster than human ones. Reviewers are not being more careful with bigger diffs. They are skimming them.
The downstream bill shows up in Faros telemetry: incidents per PR up 242%, bugs per developer up 54%, median review time up 441%.
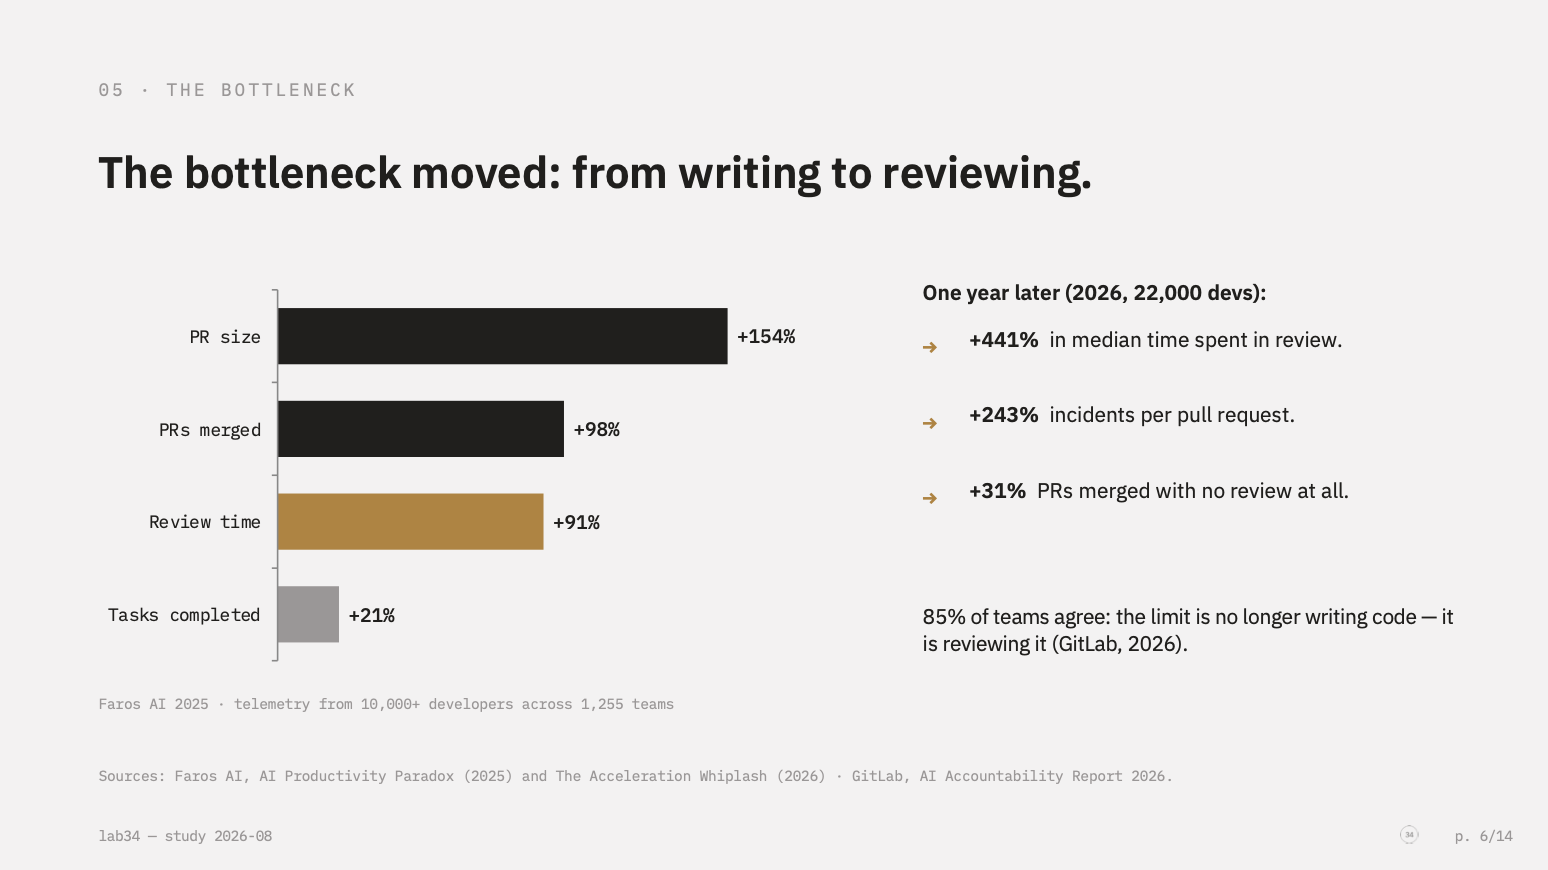
If your sprints feel slower while everyone claims to move faster, this is usually where the time went.
Maintainability is eroding, and it is measurable
GitClear tracks how code changes year over year, across hundreds of millions of changed lines. Their 2026 report reads like a slow leak.
Duplicated code blocks are up 81% in three years — the highest level on record. Refactored (“moved”) code collapsed from 21% of changes in 2022 to 3.8% in 2026. Copy/paste grew from 9.4% to 15.7%. Updates to legacy code fell 74%, and cross-file reuse of existing functions fell 35% since 2023.
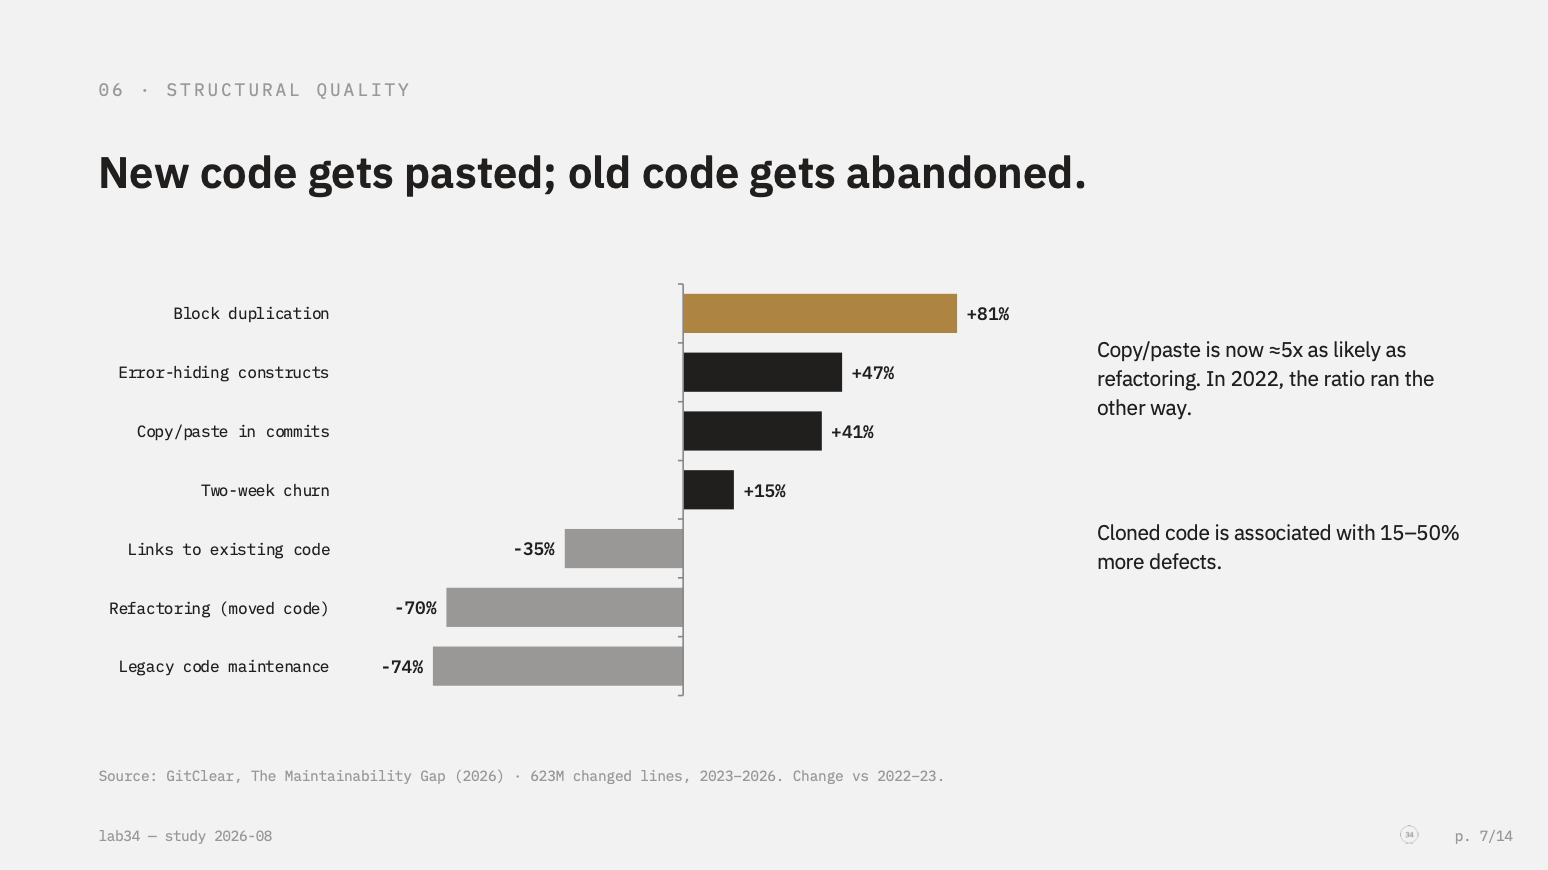
The pattern is consistent: assistants add new, isolated code instead of reusing what exists.
None of this fails a sprint review. All of it compounds. It is debt taken out in 200 small commits, with no single moment where anyone decided to borrow.
Technical debt still eats the sprint
Debt was the top complaint before AI, and it still is. 62–63% of developers rank technical debt as their #1 workplace frustration, and they report 17+ hours a week on maintenance and debugging. Sonar puts the cost at 20–40% of sprint capacity in debt-heavy teams.
The scrum mechanics feeding it haven’t changed. Under deadline pressure, QA gets compressed first. Scope creeps in mid-sprint. The Definition of Done bends exactly when the burndown looks bad.
What changed is the inflow. 88% of developers report at least one way AI has increased their technical debt: code that looks functional but isn’t reliable (53%), or redundant code the codebase already had (40%).
The “almost right” tax
Stack Overflow’s 2025 survey found the #1 frustration with AI tools: 66% of developers point to solutions that are almost right, but not quite. 45% say debugging AI-generated code takes longer than expected. Belief that AI can handle complex problems dropped from 35% to 29% in a year.
“Almost right” is expensive precisely because it is almost right. It passes the linter. It reads clean inside a 400-line diff. It fails at a service boundary two weeks later.
For estimation this is poison. A story looks 80% done in two days, then stalls in a verification tail nobody planned. The velocity chart says the team sped up. The sprint commitment says otherwise.
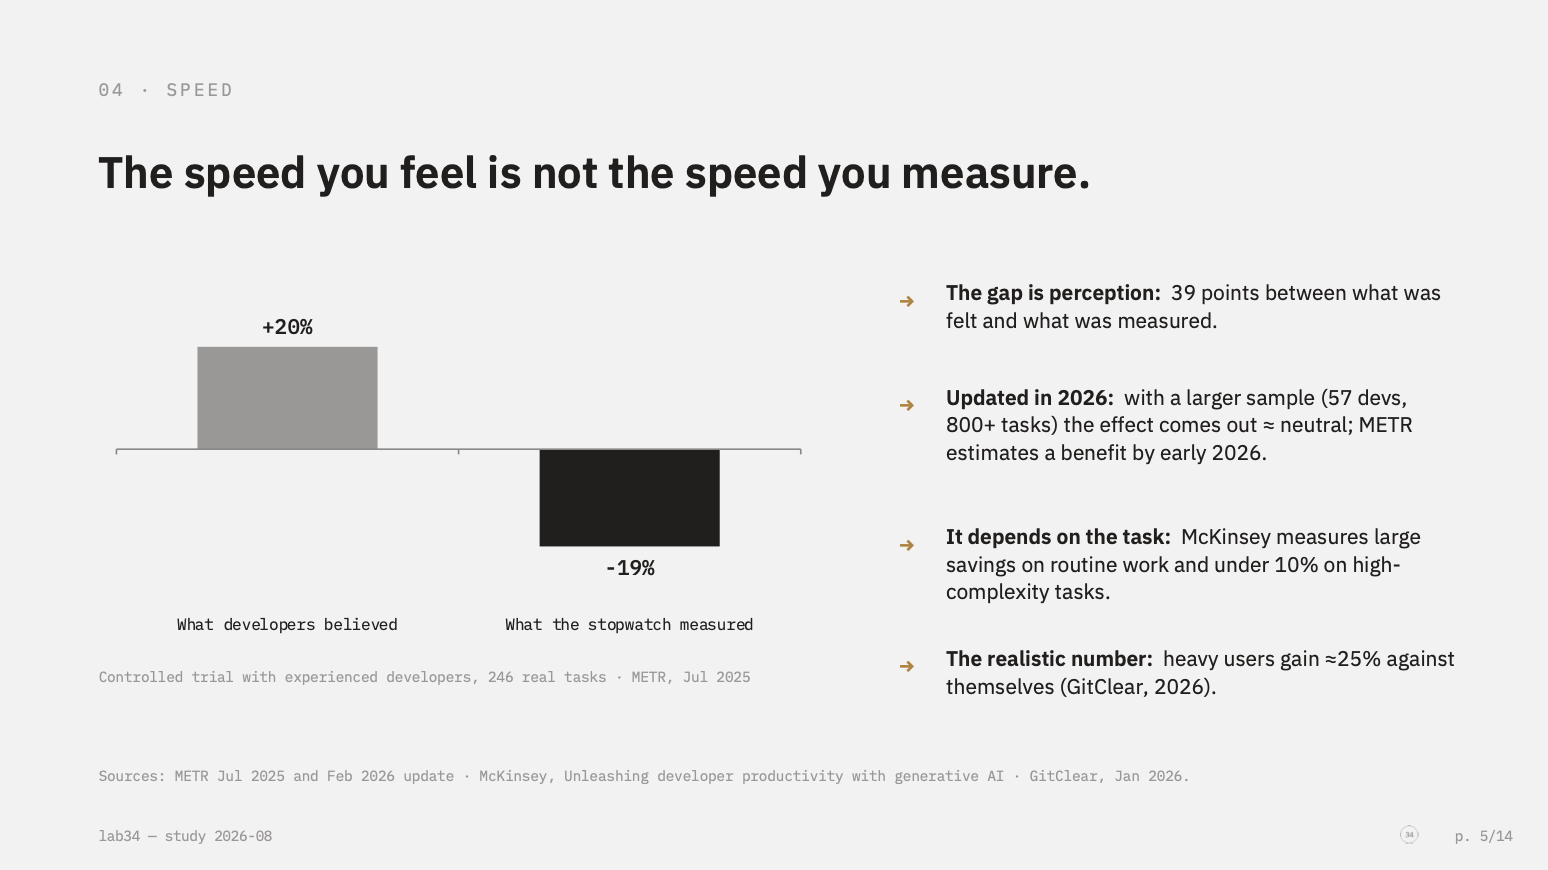
That gap between felt and measured speed is the part teams most often plan against. METR put experienced developers through 246 real tasks on their own repositories: they believed AI made them 20% faster, and the stopwatch said 19% slower — a 39-point gap between perception and measurement. METR’s own 2026 update, on a larger sample, lands closer to neutral. Either way, the number to plan with is not the one the team feels.
This is a systems problem, not a developer problem
Individual metrics rise almost everywhere — tasks completed, PRs merged. Organizational metrics don’t follow. 63% of organizations still struggle to deliver reliable software, only 27% say agile delivers real value, and just 49% have any governance guardrails for AI use.
Blaming developers for AI-era quality problems is blaming drivers for a road with no lanes.
What the teams that escape it do
DORA profiles the teams that get compounding benefit from AI. Their habits are unglamorous:
- Small batches, enforced. PRs stay small even when the assistant offers 400 lines. It protects review depth and shrinks the blast radius of every change.
- Quality gates at the PR, in CI. Static analysis, duplication and coverage checks that block new debt before merge. Same bar for human and AI code.
- A Definition of Done that doesn’t bend. Tests, docs, no new duplication. Scope is negotiable at sprint end; quality is not.
- A standing budget for debt. 15–20% of each sprint for refactoring and legacy care — exactly the work GitClear shows is disappearing.
- An explicit AI policy, plus context. Working agreements on where AI is used, and internal conventions and libraries fed to the tools so they reuse instead of duplicate.
- Platforms and version control discipline. The boring infrastructure that turns individual speed into organizational throughput.
Nothing on that list is new. That is the point. AI didn’t change what quality engineering is; it raised the price of not doing it.
It is also the bar we hold our own work to at Lab34: small batches, gates in CI, and a Definition of Done that doesn’t move.
Before you quote these numbers
Sources
The full study, with every chart and the complete source list:
The datasets behind the figures, at first hand:
- DORA — State of AI-assisted Software Development (Google, n≈5,000)
- Stack Overflow Developer Survey 2025 (n=49,000+)
- GitClear research (623M changed lines, 2023–2026)
- Faros AI research (10,000+ developers, 2025; 22,000 developers, 2026)
- METR — Measuring the impact of AI on developer productivity
- Veracode — GenAI Code Security Report (100+ models)
The articles cited in the text:
- DORA 2025 — State of AI-assisted Software Development (Google Cloud)
- Faros.ai — Key takeaways from the DORA 2025 report
- GitClear — The Maintainability Gap, 2026 AI code quality research
- LinearB — 8 million pull requests reveal where engineering productivity breaks down
- Stack Overflow — What leaders need to know from the 2025 Developer Survey
- VentureBeat — The hidden productivity tax of “almost right” AI code
- Sonar — Why technical debt is still your team’s biggest productivity drain
- Netguru — Software development industry challenges in 2026
- 18th State of Agile Report — 10 key insights